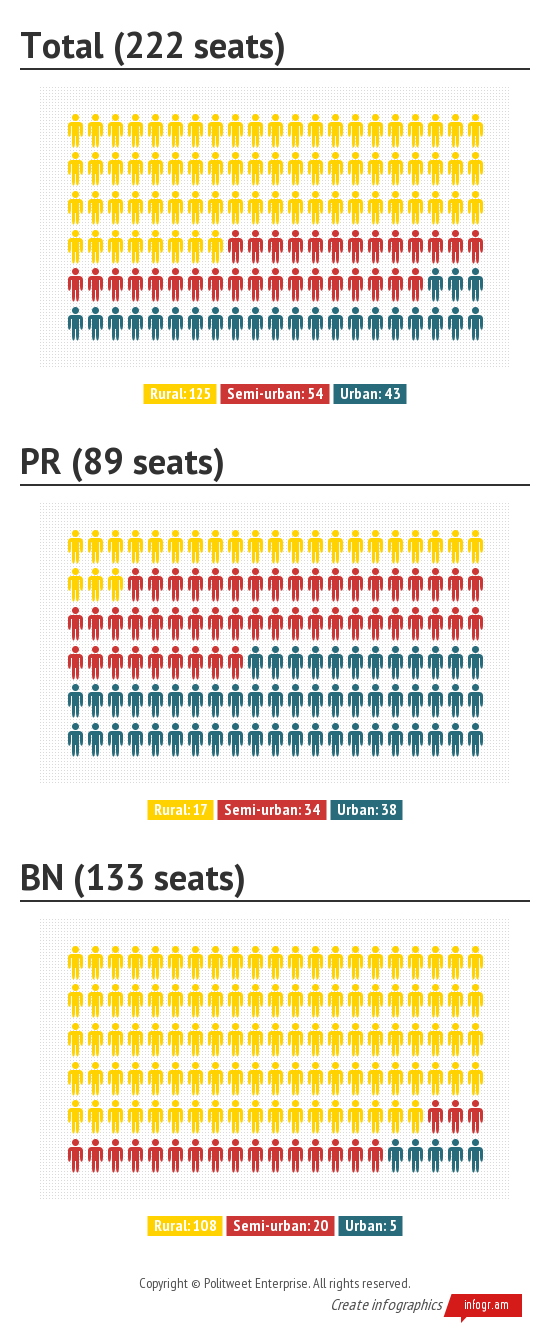
108 out of 133 seats won by Barisan Nasional (BN) came from rural seats. 72 out of 89 seats won by Pakatan Rakyat (PR) came from urban and semi-urban seats.
While it is true that PR won every Chinese-majority seat, there are only 30 Chinese-majority seats in the country. That leaves at least 59 seats won with the support of other races.
When comparing Malay-majority seats, PR won more seats than BN in both semi-urban and urban categories. A Malay-majority seat cannot be seen as a guaranteed victory for BN.
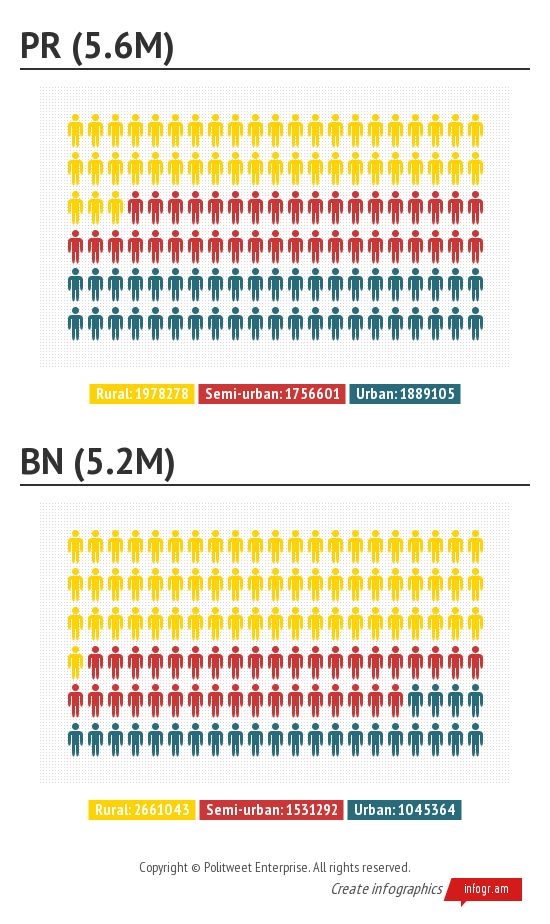
In terms of the popular vote, BN obtained 57% of the popular vote in rural seats, 47% of the popular vote in semi-urban seats, and 36% of the popular vote in urban seats. Looking at the winning majorities of individual seats, the probability of BN regaining urban seats is low. This gap in the popular vote is illustrated in the infographics at the end of this post.
That is the picture of the political urban-rural divide. BN represents the rural majority and can retain power with rural and semi-urban seats alone. This election highlighted PR’s weak areas which are rural seats, Bumiputra Sabah majority and Bumiputra Sarawak majority seats.
Research methodology
For this research we defined 3 categories of urban development:
Rural = villages (kampungs) / small towns / farmland distributed within the seat. Rural seats tend to be physically large with a low population.
Semi-urban = larger towns and/or numerous small towns, may include villages as well
Urban = cities where a majority of the seat is covered by some form of urban development
This classification was done by us based on Google Maps satellite imagery and SPR maps. This is not the same as SPR’s own internal classification of seats. You can find our reference maps here (link). The methodology was:
- Find the constituency on Google Maps (and Bing Maps, when the image wasn’t clear).
- Identify the area covered by urban development, and the degree of development
- Define the seat as rural, semi-urban or urban based on the guidelines above
This method was not ideal but it was practical given the lack of time and resources we have. A better method would be gridding (which you can read about here). We will re-examine the rural seats in the future and divide them into 2-3 categories.
We define an ethnic majority to be an ethnicity that is represented by more than 50% of the seat’s registered voters. A seat without an ethnic majority is defined as Mixed.
What follows is a summary of ethnic stats for each Parliament seat based on their category of urban development. The number of registered voters is shown in parentheses.
Total Seats
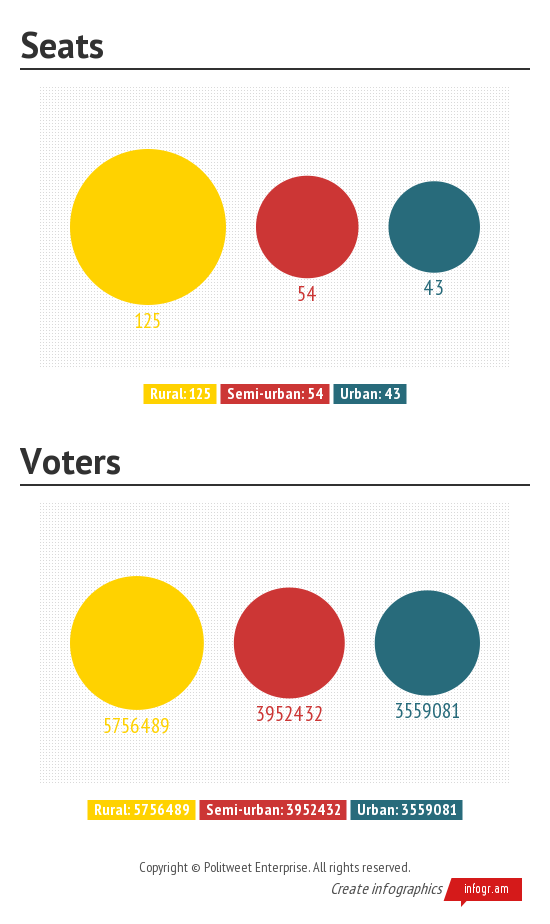
125 rural (5,756,489 voters)
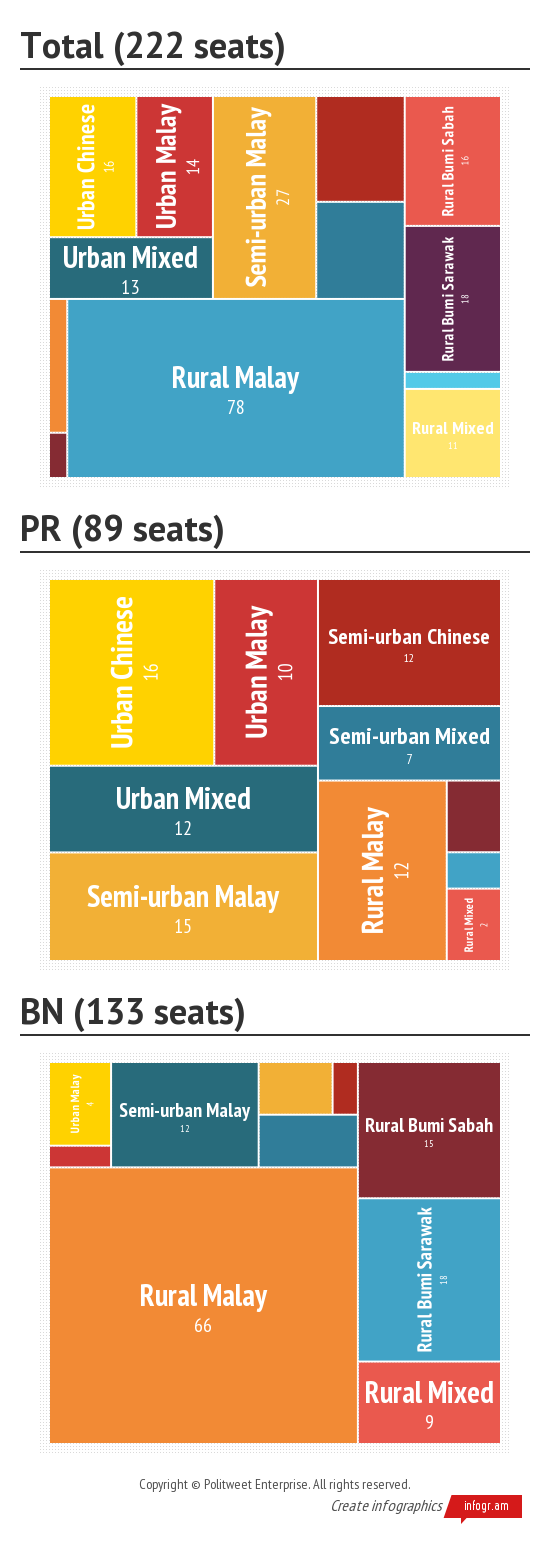
- 78 Malay majority
- 16 Bumiputra Sabah majority
- 18 Bumiputra Sarawak majority
- 2 Chinese majority
- 11 Mixed
54 semi-urban (3,952,432 voters)
- 27 Malay majority
- 12 Chinese majority
- 3 Bumiputra Sabah majority
- 1 Bumiputra Sarawak majority
- 11 Mixed
43 urban (3,559,081 voters)
- 14 Malay majority
- 16 Chinese majority
- 13 Mixed
Seats won by BN
108 / 125 rural (4,598,255 voters)
- 66 Malay majority
- 15 Bumiputra Sabah majority
- 18 Bumiputra Sarawak majority
- 9 Mixed
20 / 54 semi-urban (1,303,937 voters)
- 12 Malay majority
- 3 Bumiputra Sabah majority
- 1 Bumiputra Sarawak majority
- 4 Mixed
5 / 43 urban (330,193 voters)
- 4 Malay majority
- 1 Mixed
Seats won by PR
17 / 125 rural (1,158,234 voters)
- 12 Malay majority
- 2 Chinese majority
- 1 Bumiputra Sabah majority
- 2 Mixed
34 / 54 semi-urban (2,648,495 voters)
- 15 Malay majority
- 12 Chinese majority
- 7 Mixed
38 / 43 urban (3,228,888 voters)
- 10 Malay majority
- 16 Chinese majority
- 12 Mixed
Infographics (click for full interactive version)
Seats vs Voters by Urban Development
Seat Comparison by Urban Development
Popular Vote Comparison by Urban Development
This shows the number of votes cast for candidates from each coalition, divided by seat category.
Seat Comparison by Ethnic Majority – Urban Development
This shows the number of seats categorised by the ethnic majority group and level of urban development. To see all the labels, please view the interactive version.


No comments:
Post a Comment